Mapping Black Carbon Pollution in Sechelt, BC
Black carbon is a component of fine particulate matter (PM2.5) and is released from many sources including wood stoves and fireplaces. Black carbon poses health risks, yet it is not routinely monitored in many British Columbia communities.
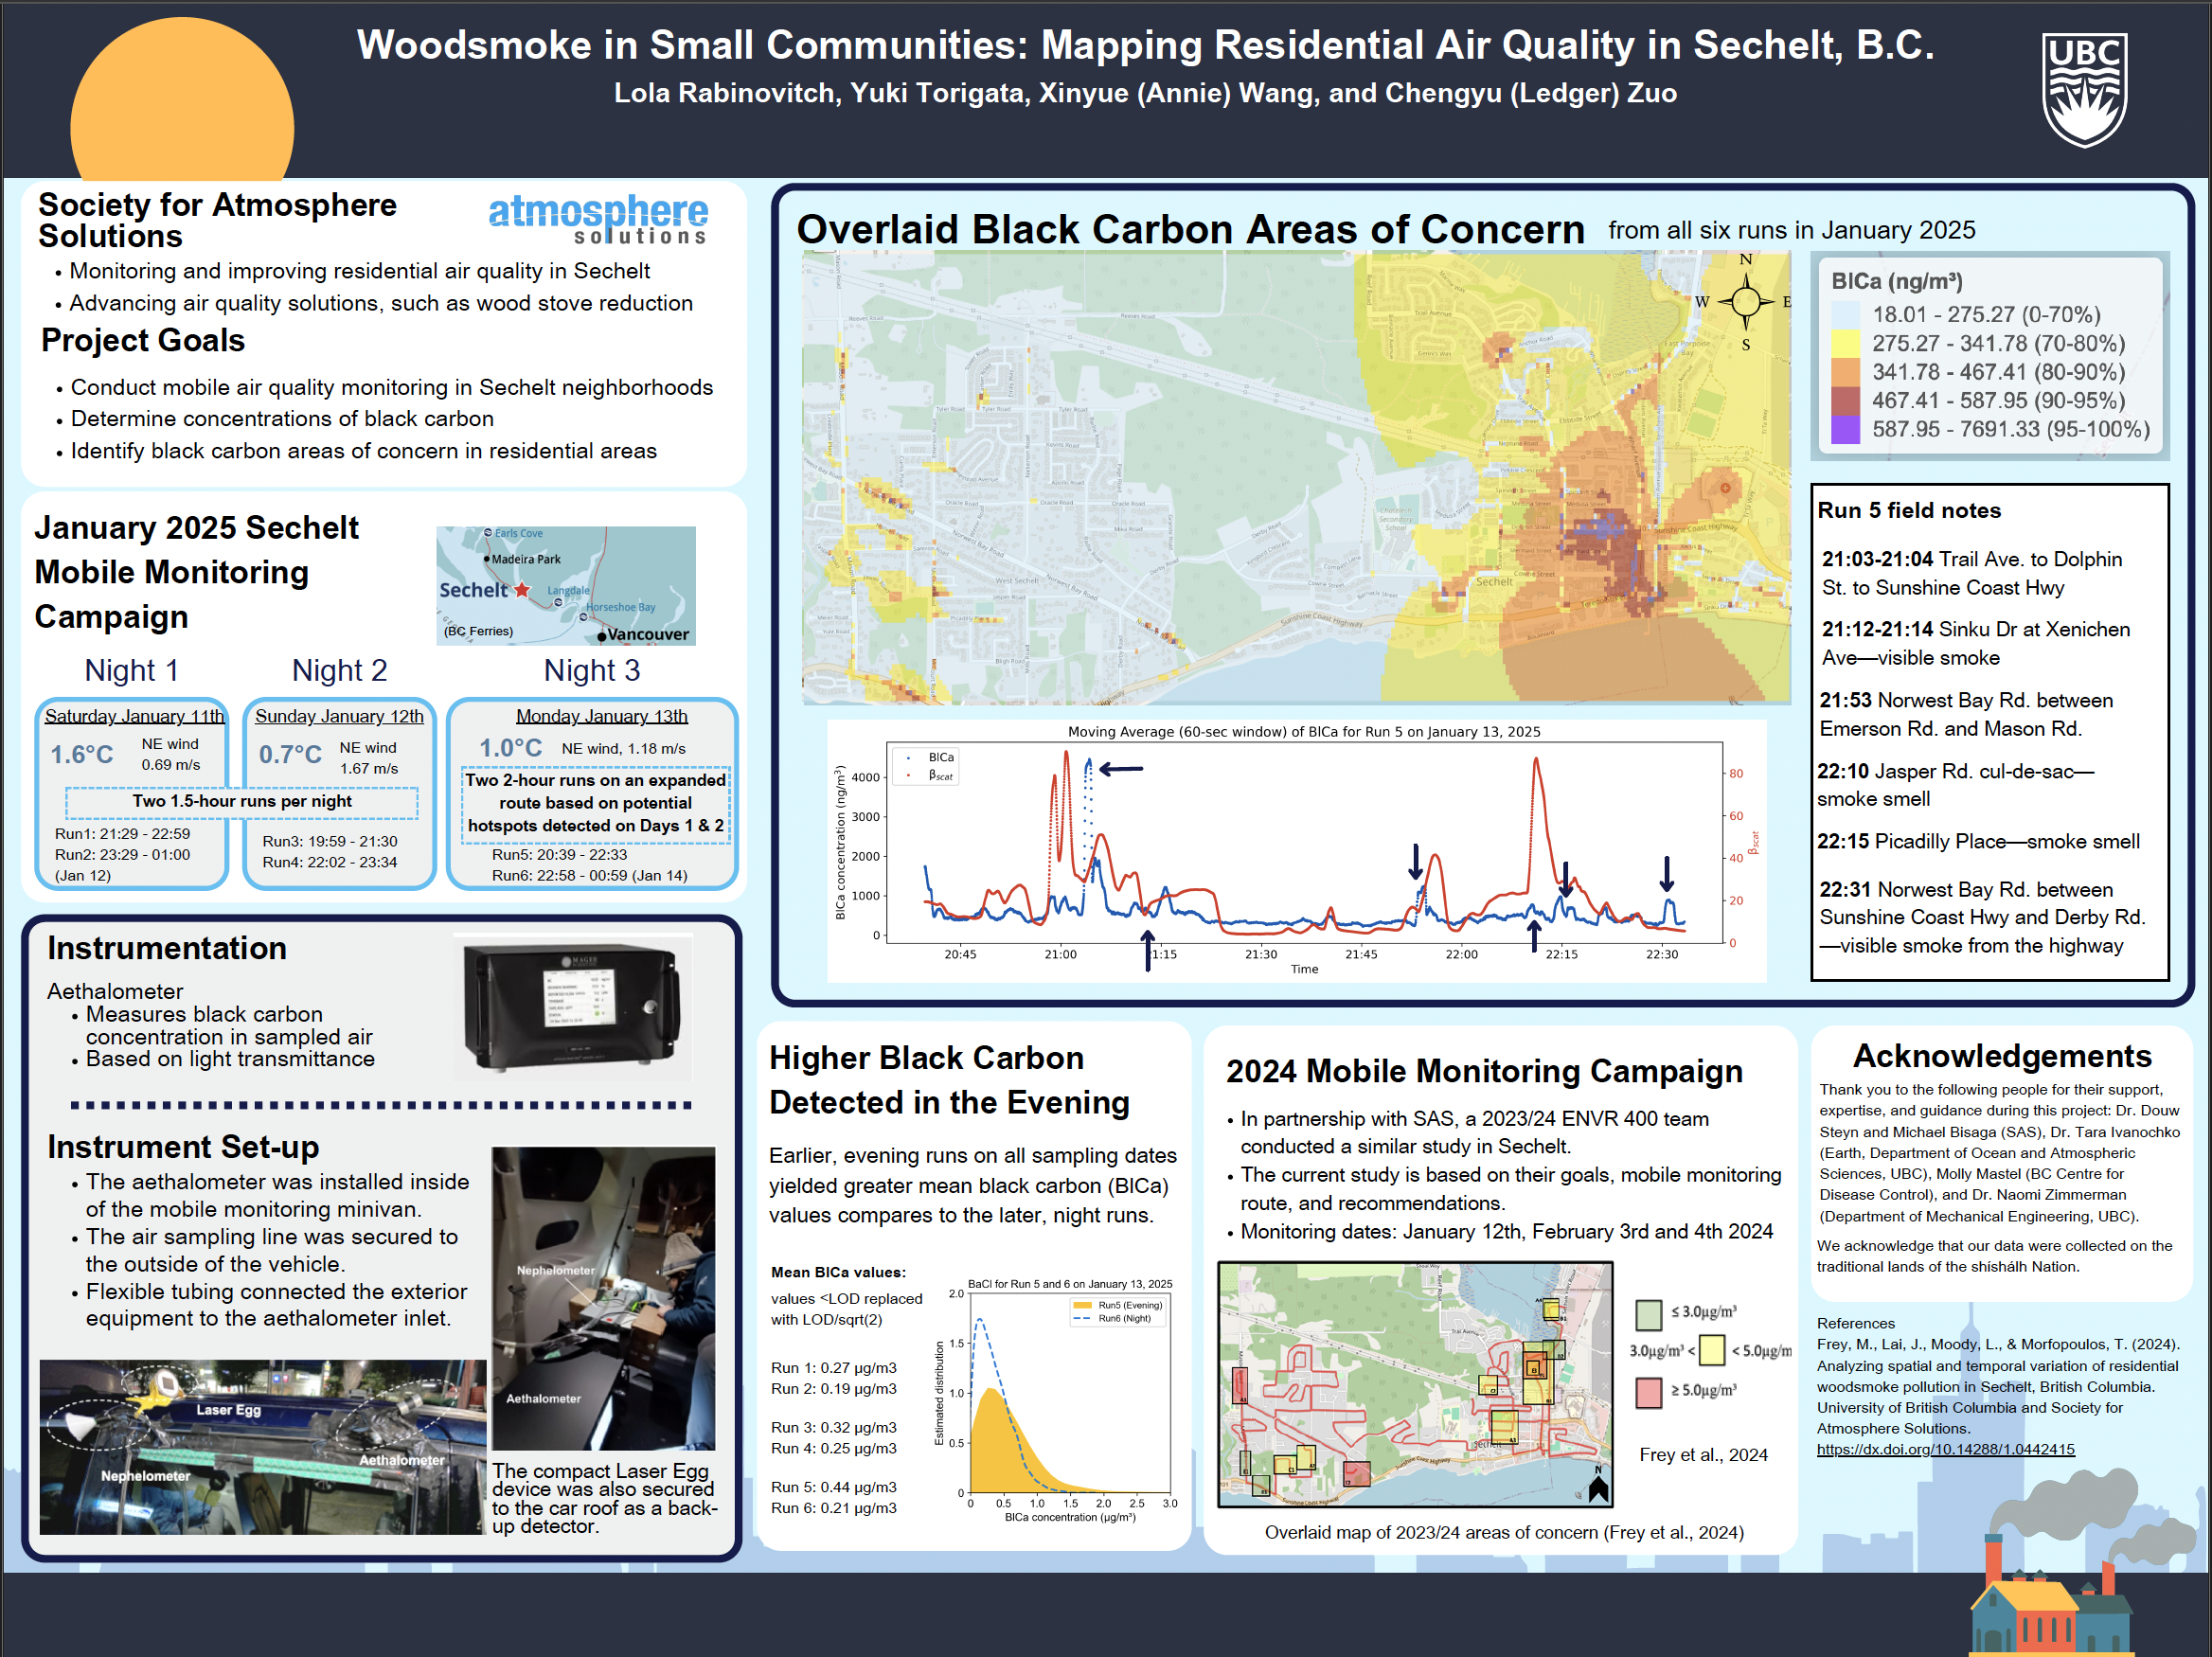
This project is a collaboration between Atmosphere Solutions and the University of British Columbia. Expanding on a 2024 pilot study, a group of four Environmental Sciences student researchers conducted a mobile air quality monitoring experiment. The study took place in Sechelt, BC, over the course of three nights in January 2025 and resulted in black carbon (BlCa) concentration data along the mobile monitoring route throughout the community’s residential neighbourhoods. Each mobile sampling session is referred to as a “run,” with six runs completed over the three nights of data collection.
The below poster provides more information about the project.

Explore the interactive maps below to examine patterns in black carbon concentrations across Sechelt.
Mapping Black Carbon in Sechelt
In January 2025, black carbon levels were measured along the major residential streets of Sechelt through mobile sampling. To reduce short-term fluctuations, the data was smoothed using rolling 30-second averages. To visualize pollution levels across the entire region—including areas where direct measurements weren’t taken—we used a method called Inverse Distance Weighting. This technique estimates values in between sampling points and around the sampling routes by giving more influence to closer measurements, creating a smooth and continuous map of air quality.
The colour gradient on the maps shows how black carbon concentrations vary across the region based on percentiles, which compare each measurement to the entire dataset collected across six runs. These percentiles allow us to highlight pollution “hot spots” in the region. For example, areas shaded in bright purple represent the highest black carbon levels recorded (the top 1% of the entire data set), while light blue shows the areas with the lowest concentrations.
The base map is provided by OpenStreetMap, and the data visualization was created using Leaflet in R.
1. Black Carbon Concentrations (ng/m³) from all Six Runs
This interactive map visualizes black carbon concentrations in ng/m3, measured during all six data collection runs in Sechelt, BC, in January 2025.
2. Black Carbon Concentrations (ng/m³) from Individual Run
Run 1: The interactive map below visualizes black carbon concentrations in ng/m3, measured from mobile sampling in Sechelt, BC, January 11, 2025, from 21:29:45 to 22:59:45.
Run 2: The interactive map below visualizes black carbon concentrations in ng/m3, measured from mobile sampling in Sechelt, BC, on January 11, 2025, from 23:29:19 to 01:00:07 of the next day.
Run 3: The interactive map below visualizes black carbon concentrations in ng/m3, measured from mobile sampling in Sechelt, BC, on January 12, 2025, from 19:59:20 to 21:30:36.
Run 4: The interactive map below visualizes black carbon concentrations in ng/m3, measured from mobile sampling in Sechelt, BC, on January 12, 2025, from 22:02:00 to 23:34:28.
Run 5: The interactive map below visualizes black carbon concentrations in ng/m3, measured from mobile sampling in Sechelt, BC, on January 13, 2025, from 20:39:38 to 22:33:20.
Run 6: The interactive map below visualizes black carbon concentrations in ng/m3, measured from mobile sampling in Sechelt, BC, on January 13, 2025, from 22:58:40 to 00:59:47 of the next day.
3. PM 2.5 (μm/m³) from all Six Run
The interactive map below visualizes PM2.5 concentrations in μm/m3, measured from mobile sampling in Sechelt, BC for all six runs
